- Data Basin |
- Use Cases |
- PREFERENTIAL SITING FOR DISTRIBUTED SOLAR PV
PREFERENTIAL SITING FOR DISTRIBUTED SOLAR PV

Using the DG Screening Tool for Lancaster, California
Overview
The California Energy Commission funded the creation of a first-of-a-kind Distributed Generation (DG) Screening Tool (www.dg-solar.org) that simultaneously examines DG photovoltaic (PV) technical, economic and environmental project potential(www.dg-solar.org). This Lancaster, CA case study demonstrates the online tool’s functionality and documents the resulting DG portfolios. Overall, the tool has been found to create DG potential portfolios with minimized environmental impact based on user criteria in an easily accessible format based on a unique combination of environmental and engineering geospatial data.
Background
Environmental, engineering, cost, and electrical distribution grid data remain largely disparate despite the evolution toward accumulating information in geospatial datasets. The DG Screening Tool integrates this information for planning and decision making, specifically in the Lancaster, California pilot area. The team identified distributed solar photovoltaic developers, local and environmental planners as the primary audiences for the application. Secondary audiences such as utilities and county agencies were also identified at the project onset. Five types of solar photovoltaic were considered the most commercially viable, distributed generation for the Lancaster, California area: ground mounted (tracking and fixed systems), as well as commercial rooftop, parking lot, and residential photovoltaic systems. Four use cases were developed and tested with results documented for each portfolio including total project count, total project capacity and project cost range for each scenario.
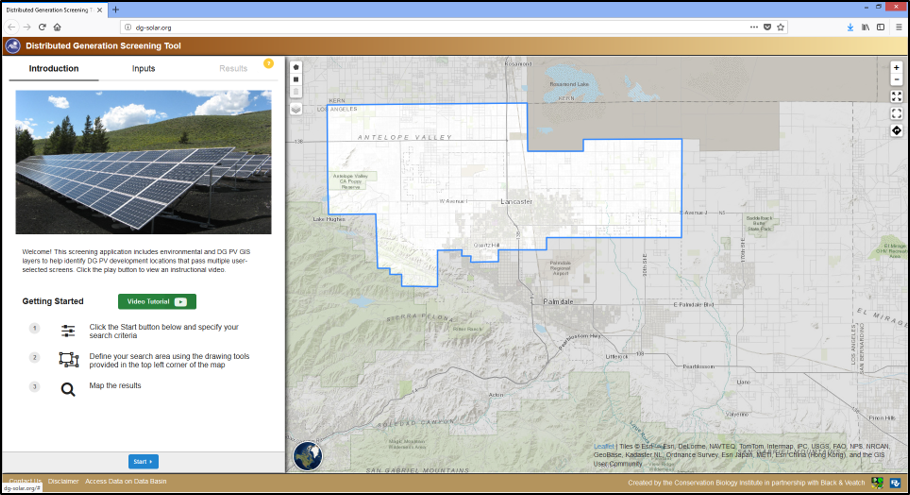 Fig 1. DG Screening Tool Energy Inputs Page
The tool allows users to enter inputs and identify the parcels that match their DG search criteria. Users can select a study area within the tool and define energy, environmental and cost inputs within tabs of same name in the tool. Remaining parcels that pass the selected screens are displayed visually as a list and on the map as demonstrated as an example in Figure 2. The outputs depend on user inputs; as more restrictive selections are made, fewer parcels are expected to meet all entered criteria.
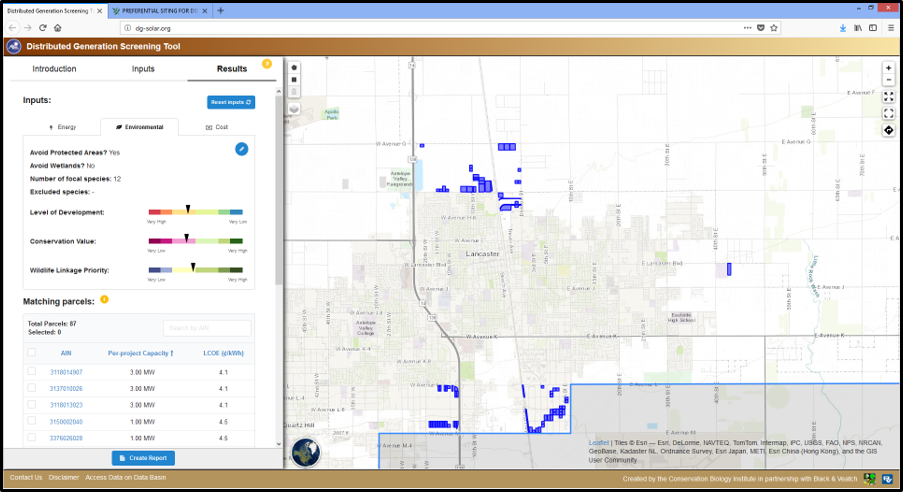 Fig 2. Display showing parcels passing the selected screening criteria
The user can adjust input selections and map the results again or create parcel-specific or portfolio reports.
The goal of combining technical, economic and environmental datasets in a single tool is to offer expedited project planning, reduced permitting and point of interconnection screening, and clearer stakeholder understanding of developable DG potential. The tool is designed to foster proactive system planning and provide an improved sense of regulatory impacts.
Case Studies
This case study demonstrates the DG Screening Tool functionality and highlights use cases for each of the four DG types (utility scale ground mount (tracking/fixed), carport and rooftop) from the perspective of likely users. In each case, initial user inputs were selected to create an inclusive baseline portfolio. From the baseline, for a specified DG type, parameters were adjusted to represent a range of input selections different users might select.
Four base cases were developed and sensitivity cases were used to explore modifications to the environmental, design and economic inputs. Results of the selected cases and tests were recorded using the reporting function of the tool and summarized in terms of portfolio capacity, number of available projects and cost ranges.
Case 1 – Ground Mount, Tracking System (3-20+ MW), 3rd Party Owned
This case was selected to explore the types of screens of interest to a third party DG PV developer of larger-sized systems. Given the proliferation of flat, developable land and high solar irradiance in Lancaster, environmental requirements and distance to POI are key factors for developers in determining project feasibility. Test cases were developed to represent interconnection and environmental screens that could be used to remove anything but prime parcels. Table 1 summarizes inputs changed under each test case.

As each screen was applied in the test case, projects no longer meeting criteria were removed and available parcels and total portfolio capacity adjusted accordingly. There was a significant variation in results across tests as shown in Figure 3. From this study, the most constrained environmental case was found to be Test 3, where 99 percent of projects in the base case screen were eliminated leaving only one, 3 MW, project. In general, the environmental screens applied in Tests 2 to 5 significantly refined the portfolio, while including the entire Lancaster region beyond city limits greatly increased the available DG capacity in the base case. Tests 6 to 8 showed that the distance to POI is not a significant constraint in the city limits which indicates close proximity of grid facilities.
 Figure 3.Case 1 Parcel Count and Portfolio Capacity Results
Since cost adjustments were not applied for these tests, a standard range of 3.5 – 4.1 ¢/kWh was observed for project LCOE in all cases which is reasonable given parcel sizes ranging up to 20 MW.
Case 2 – Ground Mount, Fixed Tilt System (250 kW – 3 MW)
The Case 2 study was designed to examine screens relevant to ground mount, fixed tilt systems. Similar to the tracking projects, the Lancaster area provides many site options with prime solar irradiance, thus POI and environmental considerations often are key to distinguish project sites. The smaller project size associated with fixed tilt can be attractive to a larger variety of owner types including local organizations interested in community solar or load offset. Test cases were developed to examine these aspects as shown by inputs in Table 2.

The third party ownership cases resulted in a cost of energy range between 4.1 – 5.0 ¢/kWh for the portfolio while the change in ownership in Test 4 to government/NGO resulted in a range of 9.0 – 11 ¢/kWh for the same parcels. The relative differences in LCOE are associated with the cost of finance and availability of tax credits between parties. Overall results for Case 2 are shown in Figure 4.
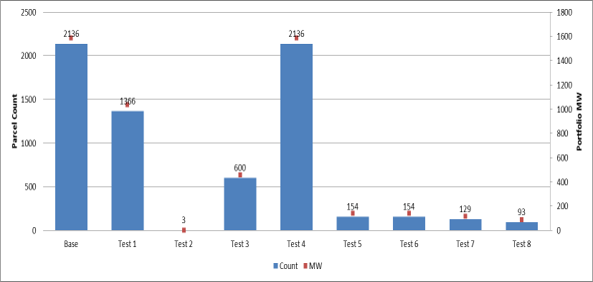 Figure 4. Case 1 Test Results Parcel Count and Portfolio Capacity
The most constrained environmental screen was found in Test 2 which identified three parcels for a total capacity of 1.2 MW. The POI screens were found to have impact in the study area examined in Tests 5 – 8. The unconstrained Test 5 returned 154 parcels (135 MW) whereas when POI distance was limited to within 0.5 miles in Test 8 only 60 percent of parcels remained (93 parcels, 84 MW).
Case 3 – Carport, Commercial Parking Lots (1 – 3 MW)
This case examines solar PV carports in commercial and industrial parking lots. Because parking lots are typically located in urban centers, where environmental screens are not particularly useful, they are also typically adjacent to existing electrical infrastructure where the availability of capacity for DG is of particular interest. The project may also be developed by third party installers or directly by the commercial owner of the parking lot. Test cases were developed to examine these aspects. The assumptions and associated portfolio results are shown in Table 3.

The results show that two of the largest parcels were screened out when using the Fast Track screen. In addition, ownership and CAPEX adjustments were found to impact LCOE. Given the limited number of parcels matching these criteria, it was useful to examine the most attractive parcels by applying a satellite-image layer within the DG Screening Tool. Figure 5 shows a screenshot of the tool for the largest parking lot area with nearby Fast Track capacity. Within the tool, the facility was identified to be a Walmart Supercenter.
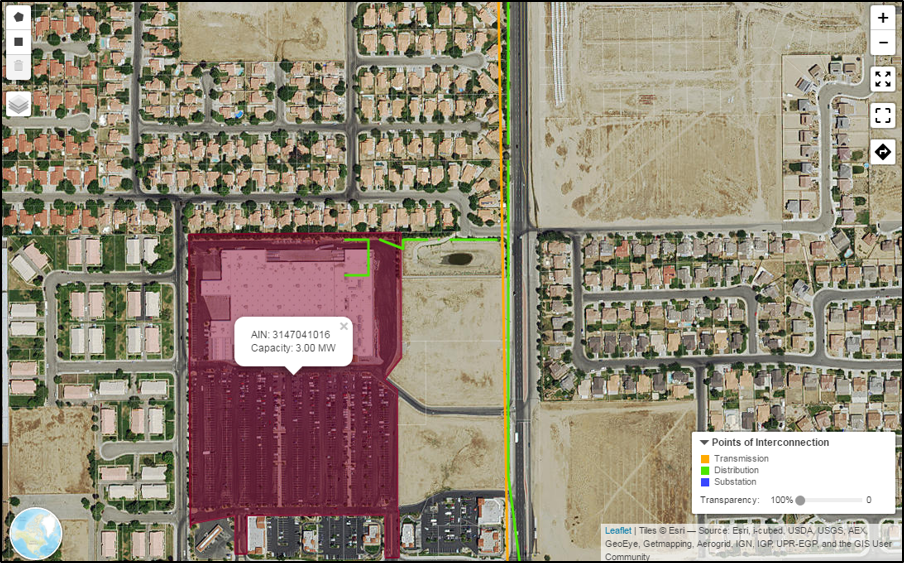 Figure 5. Satellite-image layer and SCE Grid for Largest, Fast Track Parcel Selected by the Tool
Case 4 – Residential Rooftop, Ownership, LCOE & DG Size Screens
To review relevant features of a residential rooftop portfolio a study area was selected in a neighborhood in northwest Lancaster. Project capacities for residential sites are determined by the rooftop size of a particular home. In addition to development directly by homeowners, the project may also be developed by third party installers. Test cases were developed to examine these aspects. The assumptions and associated portfolio results are shown in Table 4.

The results demonstrated that by restricting project size, the total available parcels were significantly constrained (57% reduction in parcels) and the LCOE range was narrowed due to economies of scale in accordance with the size. Change in ownership type had a limited impact on the overall LCOE and implementing a LCOE maximum threshold eliminated projects with energy costs above that value.
It was observable from the results interface in the tool that a significantly lower number of parcels were selected in Test 1 as compared to the Base Case. This is demonstrated in Figure 6 which shows a screenshot of results for the same neighborhood under each scenario.
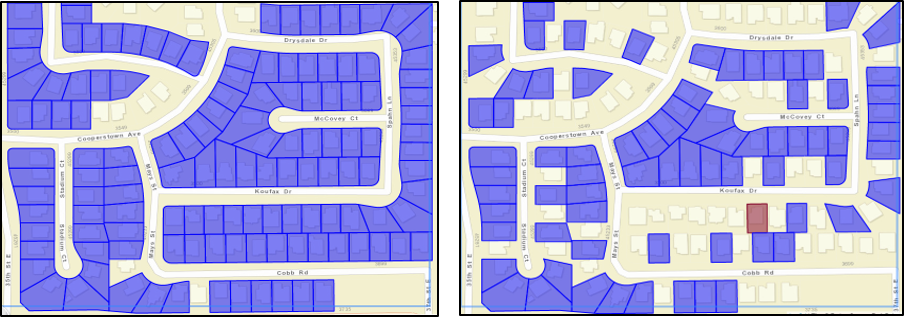 Figure 6. Base Case (Left) and Reduced Number of Selected Parcels, Test 1 (Right)
It can be seen that the largest and smallest rooftops are removed when the size range is limited between 10 – 20 kW.
Case Study Results and Conclusions
The presented studies demonstrate the overall functionality of the DG Screening Tool across a variety of DG types and possible use cases. In addition to the individual cases previously examined, comparisons can be made across the portfolios; the chart in Figure 7 demonstrates a comparison of observed LCOE across the five DG types.
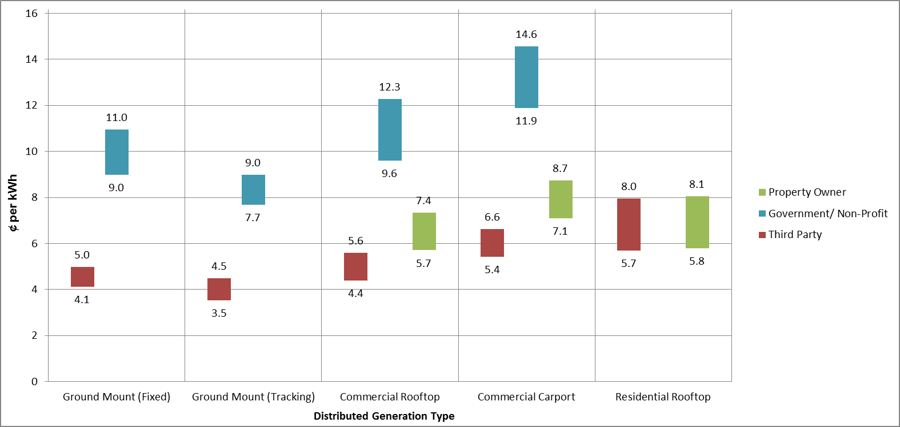 Figure 7. LCOE Range by Ownership and Distributed Generation Type (100% CAPEX)
Additional Lancaster DG findings that can be concluded from the pilot cases include:
- 2,200 MW of ground mount capacity (fixed and tracking) were identified in Lancaster City Limits (prior to environmental or POI screens).
- Stronger environmental screens were found to be highly effective at screening out otherwise attractive parcels in some cases identifying a single parcel matching criteria.
- Distance to interconnection had marginal impact on tracking project screening within city limits; in areas outside of the city limits for fixed tilt projects the screen eliminated up to 40 percent of parcels when constrained to distances less than 0.5 miles.
- Third party development costs range from 3.5 to 8.0 ¢/kWh depending on the DG type.
Along with individual case results and screenshots presented, detailed PDF reports were generated using the export function of the tool. The aggregated parcel reports were created for each of the 26 total test cases and included portfolio summaries and parcel numbers for each selected parcel.
Overall, the tool has been found to select accurate DG potential portfolios in easily accessible format based on a unique combination of environmental and engineering geospatial data.
Karlynn Cory, Elizabeth Waldren (Black and Veatch Corporation, B&V;)
Black and Veatch, 353 Sacramento Street, Suite 1900, San Francisco, CA 94111 Phone: 415-292-3556 (www.bv.com)
Jim Strittholt, Gladwin Joseph, Kaveh Karimi-Asli (Conservation Biology Institute, CBI)
Conservation Biology Institute, 136 SW Washington Ave # 202, Corvallis, OR 97333 Phone: (541) 757-0687 (www.consbio.org)
Prepared for: California Energy Commission, contract EPC-15-029
- Citation
- Conservation Biology Institute. 2017. PREFERENTIAL SITING FOR DISTRIBUTED SOLAR PV. In: Data Basin. [First published in Data Basin on Dec 12, 2017; Last Modified on May 8, 2018; Retrieved on Feb 7, 2026] <https://databasin.org/articles/ab0b187bcc254cdd997573722e8ffcfa/>
About the Author
We provide advanced conservation science, technology, and planning to empower our partners in solving the world’s critical ecological challenges