- Data Basin |
- Datasets |
- Biodiversity Hotspots Revisited, Conservation International, 2011
Biodiversity Hotspots Revisited, Conservation International, 2011
- Description:
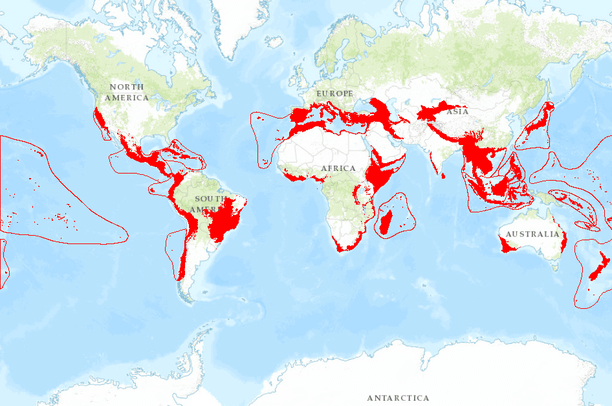
- The biodiversity hotspots are regions known to hold especially high numbers of species found nowhere else, yet their remaining habitat combined covers a little more than two percent of Earth's land surface. According to the criteria developed by Myers et al. (2000), a hotspot must meet two thresholds in order to qualify: 1) it must have at least 1500 endemic, native vascular plant species, and 2) it must have already lost at least 70% of its primary, native vegetation.Hotspots analysis is in constant evolution. There are two major ways in which hotspots can change over time. The first is a real effect. Threats and their impacts change, meaning that some places may become more threatened while others may recover. The second is that our knowledge of biodiversity, threats, and costs is continually improving. Over the last few years these data have become better compiled. Now, several years after the publication of the previous reassessment of the hotspots strategy, it was time to revisit the hotspots themselves.The aims of the Hotspots Revisited analysis was not to rework the entire hotspots concept; rather, it was to revisit the status of the existing hotspots, refine their boundaries, update the information associated with them and, most importantly, consider a number of potential new hotspots. Consequently, the criteria for what qualifies as a hotspot remained unchanged.
A major finding of this updated analysis is that six previously overlooked areas qualify for hotspot status. These are the Madrean Pine-Oak Woodlands of northern Mexico and the southwestern United States, southern Africa’s Maputaland-Pondoland-Albany region, the Horn of Africa, the Irano-Anatolian region, the Mountains of Central Asia, and Japan. In addition, two hotspots have been subdivided, as data are now sufficient to show that they contain quite distinctive biotas. The original Eastern Arc Mountains and Coastal Forests hotspot has been partitioned, such that the Coastal Forests of Eastern Africa stand alone as a separate hotspot (now extending into southeastern Somalia and southern Mozambique), while the Eastern Arc Mountains have been grouped with the mountains of the Southern Rift, Albertine Rift and Ethiopian Highlands to form the Eastern Afromontane Hotspot. Similarly, the Himalaya and Indo-Burma regions are now listed as separate hotspots, with the former extending further to the west into Pakistan and the northeast Afghanistan than did the Himalayan portion of the original Indo-Burma Hotspot.
The final change revealed in our reassessment of the hotspots is truly terrifying. Less than a decade ago, the islands of eastern Melanesia, while known to be extremely endemic-rich, still held largely intact habitat. Since then, rampant logging and establishment of oil palm plantations have devastated these islands, leaving only 30 percent of their forests remaining, a situation mirroring the fate of Indonesia’s forests a decade ago. In revisiting the boundaries of the hotspots, we have tried to achieve a balance between what is scientifically defensible, and what is practically acceptable. However, in order to accommodate some tropical islands that might otherwise slip through the net of conservation priorities, we have grouped certain islands with their closest-lying hotspots including: Galapagos and Malpelo with Tumbes-Chocó-Magdalena, Juan Fernandez with the Chilean Winter Rainfall-Valdivian Forests, the Azores and Cape Verde Islands with the Mediterranean Basin; and Lord Howe and Norfolk Islands with New Zealand. This is done pragmatically, and with full recognition that the floristic affiliations of these islands with their associated landmasses are often tenuous at best. Finally, delineating hotspots is by no means an exact science. It requires that a line – that might be easily discernible or rather vague on the ground – must be drawn to represent a transition between two habitats. The map of Ecoregions developed by the World Wildlife Fund-U.S. is now the most widely used system for such bioregional classification. In order to facilitate analysis, interoperability, and collaboration, we have therefore gone to considerable lengths to ensure that both the boundaries of the hotspots (and those of the high biodiversity wilderness areas) correspond directly to those of the World Wildlife Fund-U.S. Ecoregions.
For more information: http://www.conservation.org/where/priority_areas/hotspots/Pages/hotspots_main.aspx
- Data Provided By:
- Conservation Synthesis, Center for Applied Biodiversity Science at Conservation International
- Content date:
- 2011
- Citation:
-
Title: Biodiversity Hotspots Revisited, Conservation International, 2011
Credits: Conservation Synthesis, Center for Applied Biodiversity Science at Conservation International
Publication Date: 2011
Online Linkages: Other Citation Info: Mittermeier, R. A., Robles-Gil, P., Hoffmann, M., Pilgrim, J. D., Brooks, T. B., Mittermeier, C. G., Lamoreux, J. L. & Fonseca, G. A. B. 2004. Hotspots Revisited: Earth?s Biologically Richest and Most Endangered Ecoregions. CEMEX, Mexico City, Mexico 390pp.
- Contact Organization:
- Conservation International
- Contact Person(s):
- Use Constraints:
- Terms of Use: Acceptance of Terms. By using this shapefile(s) (“CI Shapefile”), you (the “User”) agree to be bound by these Terms of Use. If you do not agree to be bound by these terms and conditions, please do not use this CI Shapefile. Conservation International Foundation (“CI”) reserves the right at any time and from time to time to modify or discontinue, temporarily or permanently, any or all of this CI Shapefile (or any part thereof). CI shall not be liable to any User or other third party for any such modification, suspension or discontinuance. © 2011 Conservation International Foundation Ownership and Distribution. Ownership and Distribution of Conservation International Foundation’s (CI) Materials. The materials and content on the CI Shapefile are the property of CI, and are protected under copyright, trademark and other intellectual property laws. These materials and content include, but are not limited to, shapefiles, metadata, maps and map data, pictures, images, graphics, video, geocodes and/or geocoded data and/or data, logos, trademarks, and text. Use, reproduction and modification of the CI Shapefile for any non-profit, training, research, or educational purpose whatsoever are subject to the following conditions, criteria and limitations: 1. The metadata file, and in particular, this Terms of Use statement, forms an integral part of the CI Shapefile, and must be distributed and stored with the CI Shapefile. 2. Any use of the CI Shapefile in analysis, on any report about the analysis or findings, or in display whatsoever, must be clearly and prominently credited to Conservation International Foundation. This data source credit shall not state or imply that Conservation International Foundation is a party to or endorses any analysis, or any report about an analysis or finding unless there is a written agreement between the parties involved. Please see Output Limitations below, for an appropriate data credit wording. 3. The CI Shapefile may not be modified or altered in any manner. Modification of the CI Shapefile includes modification (editing) of the graphic shapes and / or alteration of any tabular attribute data (either in regard to individual records or to tabular item type definitions) associated with a graphic shape. Transformation of the spatial coordinate system of the data set (reprojection) shall not be construed as disallowed modification, but the shapefile thus reprojected must not be distributed without express written consent of Conservation International Foundation. 4. The CI Shapefile may not be used or offered for any direct or indirect commercial purpose or advantage, or for sale, rent, lease, or sublicense, in any state, format, or form, either in whole or in part, alone or bundled with other data or data sets, without express written consent of Conservation International Foundation. Output Limitations. Any map or graphics file that is generated from this data set will be referred to in this section as a "Reproduction". A User may create and reproduce an unlimited number of Reproductions for the User’s own personal, in-house study, or intra-institutional use subject to the property rights notice and credit requirements set forth below. Conservation International Foundation requires that the copyright credit notice appear in legible form on or adjacent to the reproduction in the following form: "Biodiversity Hotspots", Conservation International 2011 User may distribute Reproductions on paper, as long as the Reproductions are distributed freely, without charge and the Conservation International Foundation copyright notice appears in legible form or Conservation International Foundation is given legible credit as described above. This credit notice, and the use of this data set, shall not state or imply any connection between CI and any other person or organization, or any association with, or endorsement by, CI of any position implied or forwarded by any Reproduction (as defined in this section). A supplementary license is required to be obtained from Conservation International Foundation before User can reproduce and distribute any Reproductions over the Internet or other electronic networks, or in a publication that is for sale, resale, or that contains paid advertisement. These publications shall include, but not be limited to: periodicals (both learned journals and commercial and trade publications), books (including textbooks, atlases, and other books), posters, pamphlets, and other printed materials, and electronic publications (including e-books, web sites, and electronically distributed documents). In most cases this license is available free of charge. Please contact Conservation International Foundation for more details of publication use licenses: data@conservation.org or Conservation International, 2011 Crystal Drive, Suite 500, Arlington, VA 22202. Copyright. Any copyright notice contained in this Terms of Use or on any other part of this CI Shapefile shall remain intact and unaltered and shall be affixed to any use or copy of any CI Shapefile. User must include an appropriate citation crediting CI as indicated above. The name CONSERVATION INTERNATIONAL and the CONSERVATION INTERNATIONAL logo are registered trademarks and service marks. No use of these trademarks or service marks is permitted, especially use in any advertising or endorsement or any products or commercial entity, unless specific written permission is obtained from Conservation International. Disclaimer. The CI Shapefile metadata contains references to and citations of data sets generated, and work carried out, by third parties not associated with CI. Referenced data sets are versions current at the time of CI's 2004 Hotspot Revisited Analysis. Alterations to these referenced data sets by the third parties involved, subsequent to CI's analysis, has no effect upon any area delineated in this shapefile. CI DOES NOT WARRANT OR GUARANTY THAT ANY DATA, SHAPEFILE, FILE, OR OTHER INFORMATION GENERATED BY USE OF THE CI MATERIALS OR DATA WILL BE ERROR-FREE. THE CONTENT, SHAPEFILES, FILES, DATA, METADATA MATERIALS AND CI MATERIALS ARE PROVIDED “AS IS” AND CI MAKES NO REPRESENTATIONS OR EXPRESS OR IMPLIED WARRANTIES OF ANY KIND, INCLUDING, BUT NOT LIMITED TO, ANY IMPLIED WARRANTIES OF NONINFRINGEMENT, MERCHANTABILITY OR FITNESS FOR A PARTICULAR PURPOSE. Neither CI, its affiliates, its related entities, its employees, agents nor its content providers shall be responsible or liable to any person, firm, or corporation for any loss, damage, injury, claim, or liability of any kind or character whatsoever (including direct, indirect, punitive or consequential damages) related to any claim, including but not limited to, claims associated with the loss of data or profits, that are based on or resulting from or arise out of or in connection with the access, use, content, performance of or reliance on this website, any linked website, or any links contained in any linked website. Linked Sites Disclaimer. This CI website and CI Shapefile and its shapefile metadata contain links and references to other Websites that do not belong to CI. Any third-party site is outside the domain and not under the control of CI, and may have a range of terms and conditions. CI is providing the link only as a convenience. User accesses any third-party site at User’s own risk, including reliance on the content contained on or provided by such links or sites. CI is not responsible for the content or use of any third-party site or any linked site contained within the third-party site. No sponsorship, approval, or endorsement or any product, service or information provided by the third-party site is intended or implied by CI. Governing Law. User agrees that the laws of the United States and the District of Columbia, without regard to principles of conflict of laws, will govern these Terms of Use and any dispute that might arise between the User and CI or its affiliates. By visiting and using this Site, User agrees to abide by all laws of the United States of America, including any applicable export control laws regarding the use of any or all parts of this website. If any term or provision of this Agreement is for any reason held to be invalid, such invalidity shall not affect any other term or provision, and this Agreement shall be interpreted as if such term or provision had never been contained in this Agreement. This Agreement contains the entire understanding of CI and user with respect to its subject matter. Any rights not expressly granted herein are reserved.
- Layer:
- Layer Type:
- Currently Visible Layer:
- All Layer Options:
- Layers in this dataset are based on combinations of the following options. You may choose from these options to select a specific layer on the map page.
- Description:
- Spatial Resolution:
- Credits:
- Citation:
- Purpose:
- Methods:
- References:
- Other Information:
- Time Period:
- Layer Accuracy:
- Attribute Accuracy:
- Dataset Type:
-
Layer Package
About the Uploader
We provide advanced conservation science, technology, and planning to empower our partners in solving the world’s critical ecological challenges