- Data Basin |
- Datasets |
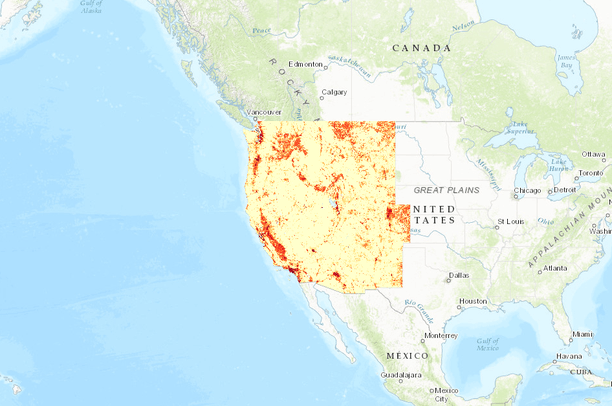
- Human modification in the western US, 2011, v20160512
Human modification in the western US, 2011, v20160512
May 13, 2016
(Last modified Sep 29, 2020)
Uploaded by
Brett G. Dickson | CSP
Dataset was reviewed in another manner
- Description:
- To map the degree of human modification, a list of stressors (or threats to natural lands) was organized based on The Human Activities Framework (Salafsky et al. 2008; http://cmp-openstandards.org/using-os/tools/threats-taxonomy/). At the top level, stressors are organized into five Level I classes: residential and commercial development, agriculture, energy production and mining, transportation and service corridors, and biological harvesting. These are further broken into 1-3 specific activities, resulting in 11 Level II classes. For each stressor, specific datasets were used on which to calculate a specific indicator(s). In total, nearly two-dozen datasets were used to depict 14 types of human activities. Each of these datasets was based on readily available spatial data that represented multiple time periods.
For each indicator, two factors were calculated at a given location (cell): intensity and footprint. Intensity (I) is the degree to which an activity at a location generally modifies terrestrial and aquatic ecosystems, which is useful to differentiate effects of different types of land uses. For example, using a patch of land as pasture is likely to have a lower overall effect on the physical integrity of ecosystems than conversion to a parking lot. The second is the footprint (F), or the areal extent of a given human activity. In practice, the footprint is measured as the proportion of a raster cell (here 30 m) that is occupied by a given land use. Thus, the overall degree of human modification (H) at a location is calculated as: H = I × F, where a value of 0.0 has no human modification and a value of 1.0 has high modification. Estimates of I and F for each indicator were made from two different sources: expert opinion or empirical datasets. For the empirically-based stressors, I was estimated as a value from 0.0 to 1.0 based on the relative amount of energy required to maintain a particular land use type, obtained from Brown and Vivas (2005). Thus, H accounts for a gradient of impact of human activities, has a direct physical interpretation, and the value remains a ratio data type so that differences within the range are meaningful (i.e. a value of 0.8 is twice the effect of 0.4), unlike most index-based approaches where values are converted to nominal or interval values. Note the H value was set to No Data (i.e., masked out) for locations (30-m cells) that intersected lakes, reservoirs, or rivers (represented by the USGS National Hydrography Dataset as waterbodies and river area maps; http://nhd.usgs.gov/; accessed June 2015).
To combine stressors and map the cumulative human modification, a method was used that minimizes bias associated with non-independence among several stressor/threats layers (Theobald 2013), and that assumes the contribution of a given threat decreases as values from other threats overlap. Locations with multiple threats will have a higher human modification value than locations with just a single threat (assuming the same value), but the cumulative human modification score converges to 1.0 as multiple human impact data layers are added. Individual factors were combined across multiple data layers using an “increasive” function (Theobald 2013), also referred to as a fuzzy sum (Bonham-Carter 1994).
References:
Bonham-Carter G. 1994. Geographic Information Systems for geoscientists. Elsevier, 398 pgs.
Brown MT, Vivas MB. 2005. Landscape development intensity index. Environmental monitoring and assessment 101:289–309.
Salafsky N, Salzer D, Stattersfield AJ, Hilton-Taylor C, Neugarten R, Butchart SHM, Collen B, Cox N, Master LL, O’Connor S, Wilkie D. 2008. A standard lexicon for biodiversity conservation: unified classifications of threats and actions. Conservation Biology 22(4):897–911.
Theobald DM. 2013. A general model to quantify ecological integrity for landscape assessments and US application. Landscape Ecology 28(10):1859–1874.
- Data Provided By:
- This dataset was produced under a contract between Center for American Progress and Conservation Science Partners, Inc. Analysis and spatial data produced by Conservation Science Partners, Inc. 2016.
- Content date:
- 2011
- Citation:
- Conservation Science Partners, Inc. 2016. Human modification in the western United States for 2011 at 270 m resolution. Conservation Science Partners, Inc. Truckee, CA, USA.
- Contact Organization:
- Conservation Science Partners, Inc.
- Contact Person(s):
- Use Constraints:
 This work is licensed under a Creative Commons Attribution 3.0 License.
- Layer:
- Layer Type:
- Currently Visible Layer:
- All Layer Options:
- Layers in this dataset are based on combinations of the following options. You may choose from these options to select a specific layer on the map page.
- Description:
- Spatial Resolution:
- Credits:
- Citation:
- Purpose:
- Methods:
- References:
- Other Information:
- Time Period:
- Layer Accuracy:
- Attribute Accuracy:
FGDC Standard Metadata XML
Click here to see the full FGDC XML file that was created in Data Basin for this layer.
Original Metadata XML
Click here to see the full XML file that was originally uploaded with this layer.
This dataset is visible to everyone
- Dataset Type:
-
Layer Package
Downloaded by
42 Members
Bookmarked by
8 Members
,
11 Groups
Included in
7 Public Maps
,
36 Private Maps
Included in
6 Public Galleries
,
2 Private Galleries
About the Uploader
Brett G. Dickson | CSP
President and Chief Scientist with Conservation Science Partners, Inc.
CSP is a 501(c)(3) nonprofit scientific collective established to meet the analytical and research needs of diverse stakeholders in conservation projects. We connect the best minds in conservation science to solve environmental problems in a comprehensive, flexible, and service-oriented manner....