- Data Basin |
- Maps |
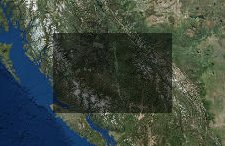
- Soil fertility map at 1 km for western North America
Soil fertility map at 1 km for western North America
Nov 24, 2014
Created by
Richard Waring

- Description
- Continuous scale from 0 (extremely infertile) to 1.0 (no nutrient limitations) derived from inverting 3-PG model to predict canopy leaf area index, with the assumption that drought -prone sites with max LAI <3.0 m2/m2 would generally have lower values of soil fertility than sites where max LAI was >3.0.For more details, see:Coops, N.C., R.H. Waring, and T. Hilker. 2012. Prediction of soil properties using a process-based forest growth model to match satellite-derived estimates of leaf area index. Remote Sensing of Environment 126:160-173.
- Location
- Credits
- N.C. Coops, T. Hilker, A. Mayths, R.H. Waring
- Use Constraints
 This work is licensed under a Creative Commons Attribution 3.0 License.
This map is visible to everyone
About the Map Author
Richard Waring
Professor emeritus with Oregon State University
My early work dealt with describing the distribution and growth of forest vegetation in relation to measured environmental gradients. In the 1980s, my interest turned toward ecosystems. More recently, my research has focused on modeling forest growth and biodiversity under changing climates, along...