- Data Basin |
- Use Cases |
- DRECP Climate Console Guide and Case Study
DRECP Climate Console Guide and Case Study
Explore related items…
CBI has developed the Climate Console, a web-based mapping application for the Desert Renewable Energy Conservation Plan (DRECP).
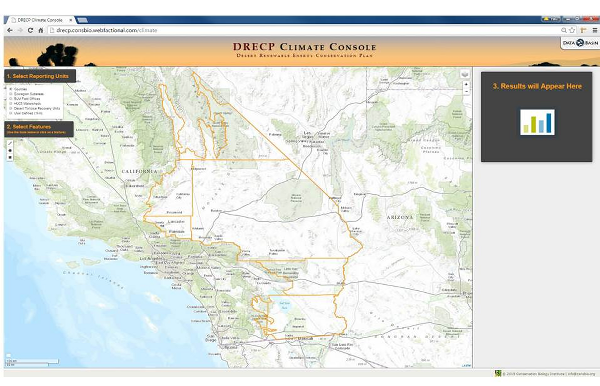
The Desert Renewable Energy Conservation Plan (DRECP) Climate Console is a user friendly web based mapping application designed to allow users to explore climate projections to better understand how climate change could alter ecosystems in the California desert. Leveraging the power of Data Basin, the Conservation Biology Institute’s web-based mapping and analysis platform, the Climate Console provides science based and actionable climate data to encourage smarter, more comprehensive landscape-level conservation planning efforts and decisions.
CBI developed the Climate Console for the California Energy Commission to perform two important tasks: 1) present and share the climate data used by the Renewable Energy Action Team (REAT) to support Plan development 2) provide information important to its effective implementation as an adaptive management strategy.
The Climate Console allows users to explore and compare climate projections for temperature, precipitation, aridity, and potential evapotranspiration, as well as EEMS model results for the DRECP study area. To learn more about EEMS, otherwise known as the Environmental Evaluation Modeling System, you can watch an instructional video or read a Guide and Case Study about EEMS.
To view the information, users choose from 6 categories, referred to as reporting units, to filter the data. Categories include: Counties, Ecoregion Subareas, BLM Field Offices, HUC5 Watersheds, Desert Tortoise Recovery Units and “User Defined”, which allows a user to define an area based on a 1 km grid. After an area is chosen, the weighted averages for the climate variables and EEMS model outputs for the selected area appear as interactive charts.

For example, the chart shows the average annual minimum temperature during the historical time period from 1971- 2000 was between 9-10 degrees Celsius. It also shows the modeled projections for two future time periods within this same area.

The Climate Console is populated with a total of 460 climate datasets and 6 EEMS model results. The EEMS model results include: Terrestrial Intactness, Site Sensitivity, Climate Exposure (2016-2045), Climate Exposure (2046-2075), Potential Impact (2016-2045), and Potential Impact (2046-2075).
Terrestrial Intactness is an estimate of current condition based on the extent to which human impacts such as agriculture, urban development, natural resource extraction, and invasive species have disrupted the landscape across the DRECP study area. Terrestrial intactness values will be high in areas where impacts are low. The Site Sensitivity Model evaluates the study area for factors that make the landscape sensitive to climate change. These factors fall into two main branches of the model: soil sensitivity and water retention potential. The Climate Exposure Model is based on aridity and climate. Climate factors include maximum temperature, minimum temperature, and precipitation on a seasonal basis and an annual basis. The Potential Impact models were generated using data from STATSGO soils data and climate model results. Results from the Site Sensitivity and Climate Exposure models contribute equally to the results of the Potential Climate Impact model.
Within the Climate Console’s interactive chart, there are 5 climate models used. The first, PRISM, is the historical climate model. The next 3 climate models were chosen to capture the range of variation of the models. Ensemble, the final model used in the chart, is the average of 3 models. These models can be turned off and on by clicking on the points within the chart or their title below the chart.

The Console currently covers the DRECP region and is being expanded statewide to include more content as well as to cover a wider geographical region. The expected launch date is December 2015.
The Climate Console is available at http://drecp.consbio.webfactional.com/climate . For more information on the DRECP, visit the DRECP Gateway on Data Basin or the DRECP website.
- Citation
- Ann Van Zee. 2015. DRECP Climate Console Guide and Case Study. In: Data Basin. [First published in Data Basin on Sep 22, 2015; Last Modified on Oct 5, 2015; Retrieved on Jul 15, 2026] <https://databasin.org/articles/3c5bc60f85964022aac4e193cd8881bc/>